


Heart rate variability (HRV) has moved from cardiology research labs into consumer fitness culture over the last decade. Whoop, Garmin, Apple Watch, Oura Ring, Polar, and many other devices now provide daily HRV measurements with associated "recovery scores" or "readiness scores" that promise to tell you whether to train hard or back off.
The underlying physiology is real. The metric is meaningful. The consumer interpretation is often muddled. Here's what HRV actually measures, what it predicts well, what it doesn't, and how to use it without becoming a slave to the daily score.
What HRV measures
The heart doesn't beat at exactly the same interval. The time between consecutive heartbeats varies from beat to beat, and the pattern of variation contains information about the autonomic nervous system's state.
This beat-to-beat variation is heart rate variability. It's measured in milliseconds, with various calculations producing different metrics. The most commonly reported in consumer devices is RMSSD (root mean square of successive differences), which captures rapid beat-to-beat changes and is most influenced by parasympathetic (vagal) activity.
A typical resting RMSSD for a healthy adult might range from 20 to 100+ milliseconds, with substantial individual variation. There's no single "normal" value because the absolute number depends on age, sex, fitness, genetics, and other factors. What matters is your own baseline and how it changes.
Higher HRV generally indicates greater parasympathetic tone — the recovery side of the autonomic nervous system. Lower HRV indicates relatively more sympathetic activation or reduced parasympathetic tone.
The reason this matters: parasympathetic dominance is associated with recovery, restoration, and adaptation. Sympathetic dominance is associated with stress response and reduced recovery capacity. HRV is one of the more accessible measures of autonomic balance.
The relationship isn't simple. Very high HRV in some contexts (overtraining state) can actually indicate the body is so depleted it's not even responding to training stimulus. Very low HRV in elite athletes during peak adaptation can be normal. The interpretation depends on context.
Why it matters for recovery
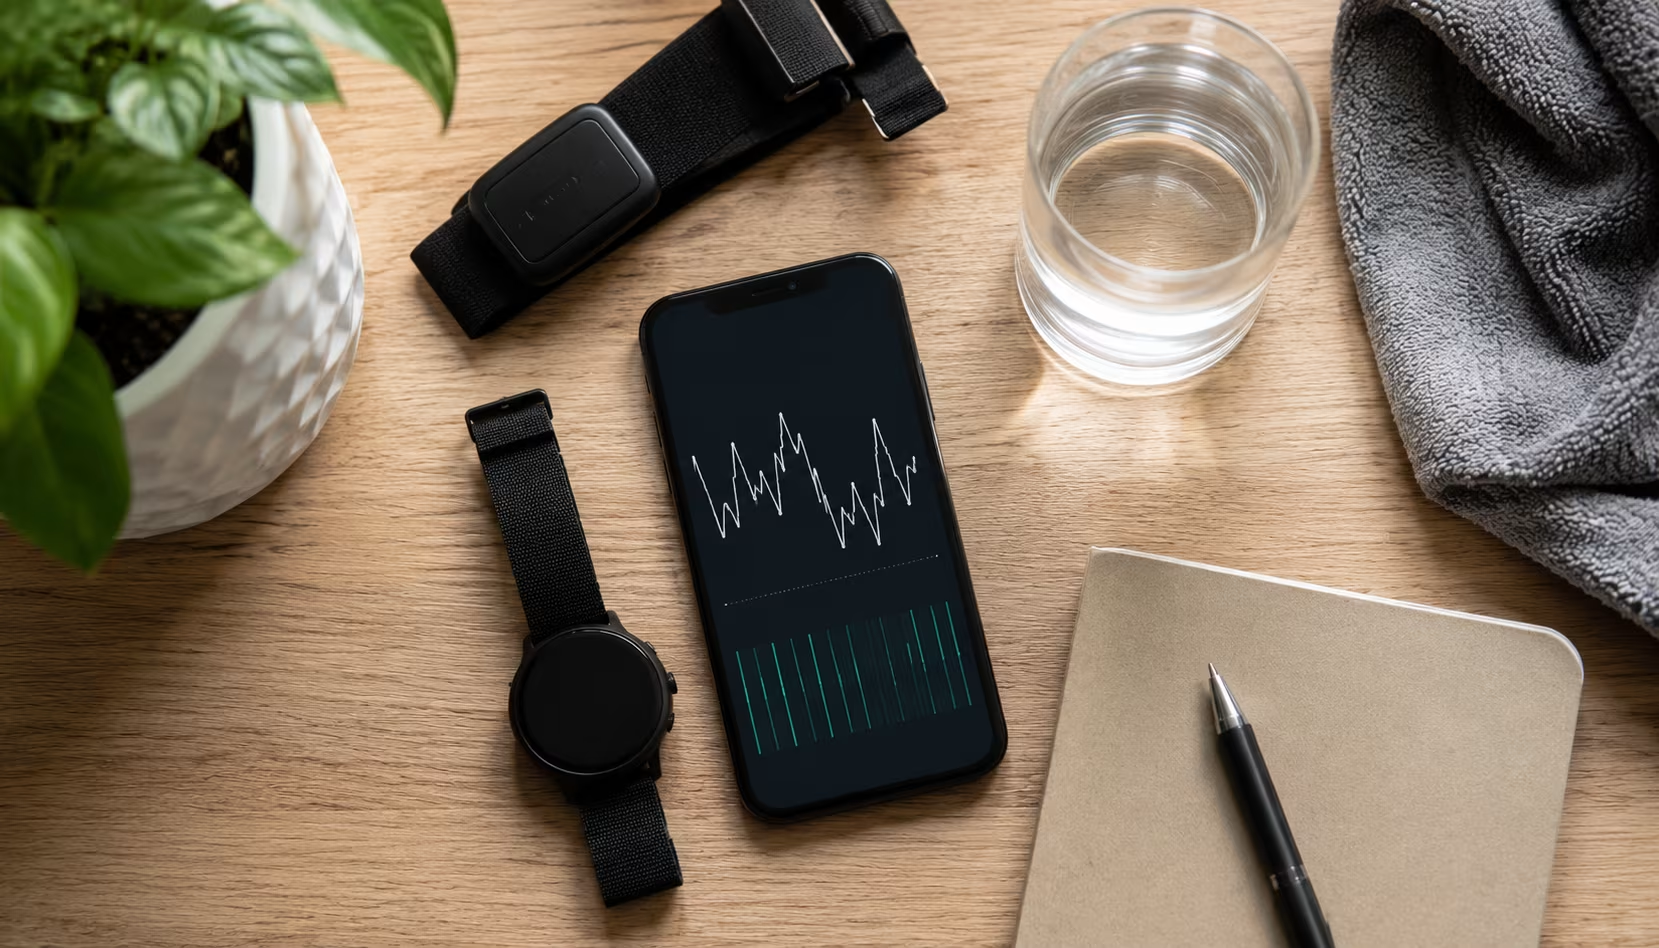
HRV correlates with several outcomes relevant to recovery and training.
Acute recovery from training HRV typically drops in the hours after intense exercise and returns to baseline as the body recovers. Faster return to baseline indicates better acute recovery. Persistent suppression indicates incomplete recovery.
Chronic adaptation Athletes who are adapting well to training typically show stable or rising HRV trends over weeks and months. Athletes accumulating fatigue beyond their adaptive capacity often show falling trends.
Overtraining Sustained suppression of HRV is one of the more reliable physiological signals of overtraining syndrome, often appearing before subjective symptoms become obvious to the athlete.
Stress Both acute stressors (work demands, illness, poor sleep) and chronic stress reduce HRV. The metric provides an objective view of stress states that subjective rating sometimes misses.
Cardiovascular health Higher HRV is associated with better cardiovascular outcomes in long-term studies. Low HRV is associated with elevated risk of various cardiovascular events. The metric is used clinically in cardiology beyond its sport applications.
Sleep quality Sleep that includes adequate parasympathetic recovery produces higher next-morning HRV than fragmented or insufficient sleep.
Hydration and nutrition Both significantly affect HRV. Dehydration suppresses HRV; recovery from food and fluid restores it.
The metric provides a window into autonomic state that subjective measures can miss. Athletes who feel fine but have HRV trending downward may be heading toward problems they don't yet feel. Athletes who feel terrible but have stable HRV may be experiencing temporary fatigue rather than underlying overreach.
How HRV is measured
The gold standard is electrocardiogram (ECG) measurement of beat-to-beat intervals, taken in controlled laboratory conditions. This isn't practical for daily monitoring.
Consumer devices use various methods to estimate HRV from less precise inputs.
Chest strap heart rate monitors (Polar H10 and similar) use ECG-quality measurement and provide accurate HRV data. These are the gold standard for at-home tracking. Apps like Elite HRV, HRV4Training, and others can read the data and provide analysis.
Optical heart rate monitors (Apple Watch, Garmin watches, fitness trackers) measure pulse using LEDs and photodetectors. The accuracy is lower than chest straps, particularly for HRV which requires precise beat-to-beat timing. These work for tracking trends but aren't quite as precise.
Finger-based devices (HRV4Training mobile app via phone camera, dedicated finger pulse oximeters) use camera technology to detect pulse changes in fingertip blood flow. Reasonably accurate for the relatively short measurement period typically used.
Whoop, Oura, and similar wearables use various combinations of optical sensors and algorithms to estimate HRV. Accuracy varies by device and conditions. The trend-following is generally useful even when absolute values may be less precise.
The measurement protocol matters. HRV varies significantly with body position, recent activity, and emotional state. The standard recommendation: measure first thing in the morning, lying or sitting still, before any caffeine or significant activity, in approximately the same conditions every day.
Single point-in-time measurements during the day are much less useful because they capture whatever happens to be happening — activity, stress, food intake, posture all affect the reading.
For people serious about HRV tracking, a chest strap and dedicated app provides the most reliable data. For most people, the wearable they're already wearing is good enough for trend tracking, with the caveat that absolute values may not be perfectly accurate.
What affects HRV from day to day
A variety of factors produce day-to-day variation in HRV that can be confusing without context.
Sleep quality and duration
Probably the largest single short-term influence. Poor sleep → lower next-morning HRV. Good sleep → higher.
Alcohol
Even moderate consumption suppresses HRV measurably the next morning. The effect persists 12 to 24 hours.
Late evening eating
Large meals close to bedtime can reduce HRV during sleep and into the morning measurement.
Stress
Acute stress reduces HRV. The metric captures both physical and psychological stressors.
Caffeine
Caffeine in the morning before measurement raises sympathetic tone and reduces HRV. This is why HRV measurement should happen before coffee.
Illness or impending illness
HRV often drops in the days before subjective illness symptoms appear, as the immune system mounts a response. A sudden HRV drop with no obvious explanation can be an early warning sign.
Menstrual cycle (in women)
HRV varies systematically across the menstrual cycle, with lower values often in the luteal phase. This is normal physiology and shouldn't be interpreted as suboptimal recovery.
Travel and time zone changes
Significant disruption of HRV that takes days to recover from.
Heat or cold stress
Both can affect HRV, particularly if the exposure was significant or recent.
Training the previous day
Heavy training significantly reduces next-morning HRV. The amount of suppression and the rate of recovery indicate how the body is handling the training load.
Hydration status
Dehydration suppresses HRV; recovery restores it.
Position changes during measurement
HRV is much higher when measured lying down than when measured standing. Consistency in position is essential.
The implication: a single low or high reading often means little. Trends over weeks are more informative than any individual data point.
Interpreting your own data
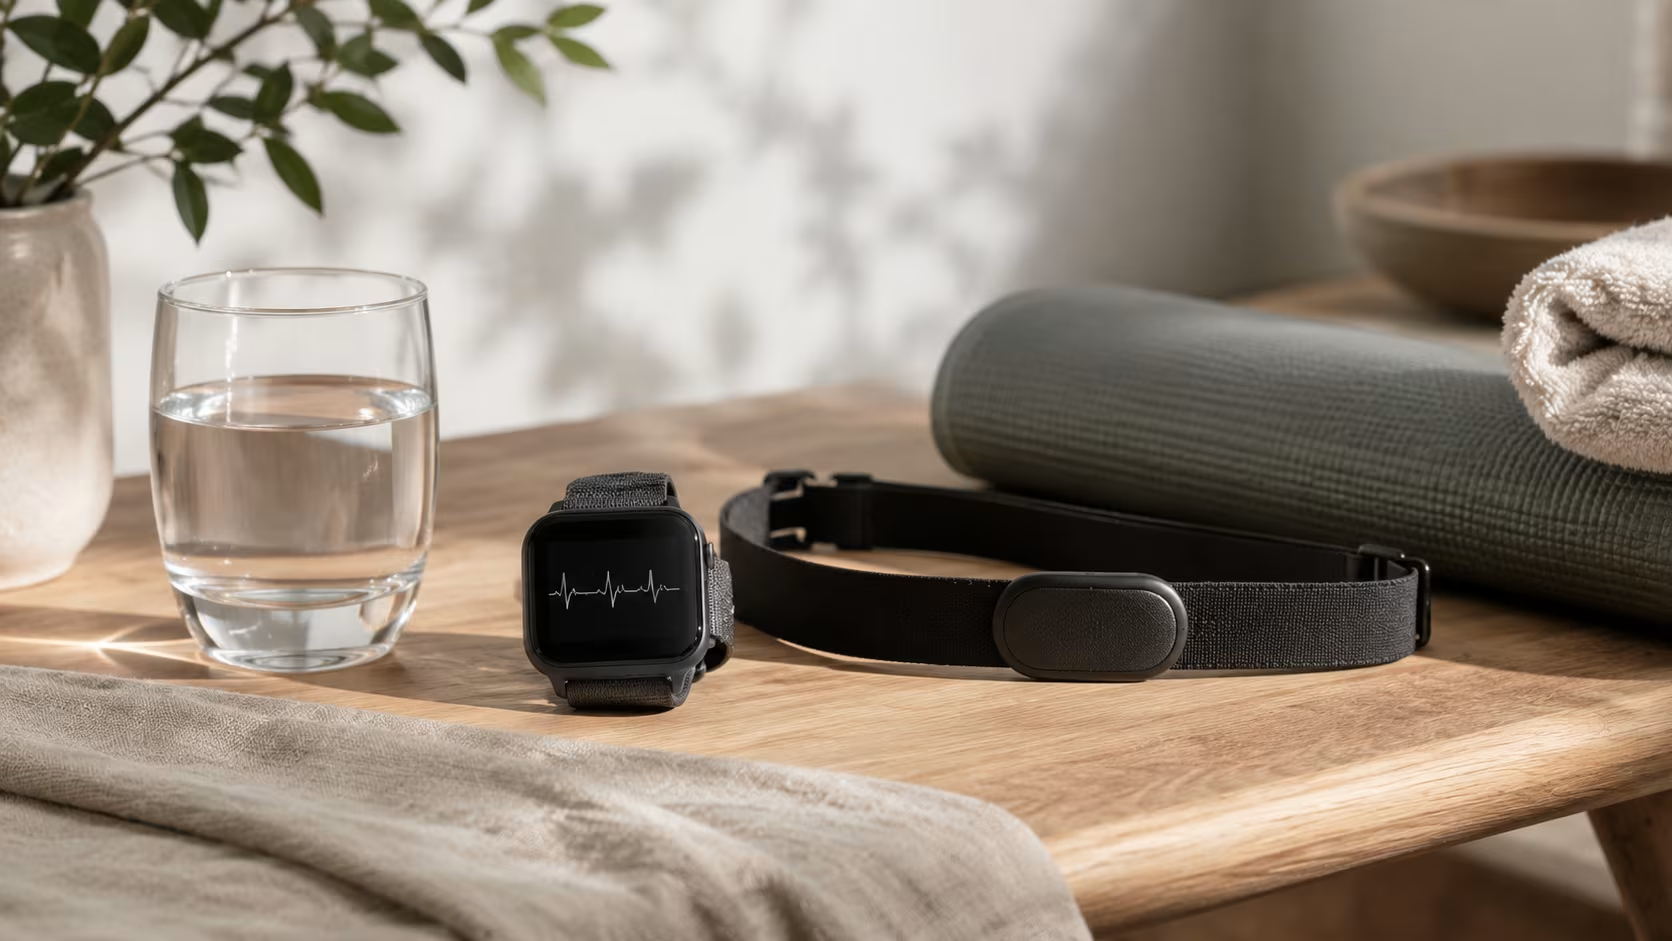
A useful framework for interpreting HRV data, drawing from the work of researchers like Daniel Plews and Marco Altini.
Establish your personal baseline first. Take 4 to 6 weeks of daily morning measurements to understand your normal range. Look at the rolling 7-day average to smooth out daily variation.
Pay attention to changes from your baseline, not absolute numbers. A morning reading 10 percent below your 7-day average is more meaningful than the absolute value of any single reading.
Trends over 3 to 7 days are more informative than single days. A single low reading is usually noise (poor sleep, late dinner, alcohol the day before, measurement variability). Multiple consecutive low readings suggest a real change worth attending to.
Different patterns mean different things:
HRV stable or rising over weeks: training is being absorbed well, recovery is adequate, adaptation is happening.
HRV stable but with single low days: normal variation in response to specific stressors. Address the stressor (sleep, training load, stress) but don't overreact.
HRV trending down for 1-2 weeks: accumulating fatigue. Reduce training load, improve sleep, address other stressors.
HRV consistently below baseline for 3+ weeks: significant overreach or overtraining. Substantial recovery period needed, possibly with reduced training and life stress.
HRV abnormally high suddenly: occasionally seen in deep overtraining states where the body has stopped responding normally. More commonly, very high single readings reflect measurement artifacts.
For consumer device users, the algorithms that produce "recovery scores" or "readiness scores" are usually some combination of HRV, resting heart rate, sleep data, and other inputs. These can be useful for daily decisions but should be interpreted alongside how you actually feel rather than substituting for that information.
Using HRV to guide training
HRV-guided training has accumulated reasonable research support over the past decade, particularly in endurance contexts.
The basic concept: instead of training a fixed weekly schedule, use morning HRV to decide whether today is a good day for hard training or whether something easier is appropriate.
Several studies have compared HRV-guided training to traditional periodized training. The results are generally positive — HRV-guided groups often achieve similar or better adaptations with less training stress, better recovery, and lower injury rates.
A 2014 study by Kiviniemi and colleagues compared HRV-guided endurance training to predetermined training in recreational endurance athletes. The HRV-guided group did fewer hard sessions overall but achieved similar fitness improvements with better recovery markers.
A 2020 systematic review by Manresa-Rocamora and colleagues confirmed that HRV-guided training produces at least equivalent and often superior outcomes compared to traditional approaches, particularly for endurance training.
Practical application: on days with good HRV (at or above 7-day rolling average), proceed with planned hard training. On days with significantly low HRV (below baseline by a meaningful amount, say 7 percent), substitute easy work or rest for what was planned to be hard.
The structure prevents the common pattern of pushing through hard training when the body is already accumulating fatigue, while not artificially limiting hard training when the body is ready for it.
For most recreational athletes, HRV-guided training is overkill. A simpler approach: use HRV as a long-term trend indicator. Stable or rising trends mean continue. Falling trends over weeks mean back off.
For competitive athletes, particularly endurance athletes, HRV-guided training is a defensible approach with research support. The implementation requires consistent measurement and willingness to deviate from the planned schedule based on the data.
The limits of consumer HRV
A few limitations of consumer HRV worth understanding.
Algorithm differences across devices
Different brands use different methods to compute HRV from the underlying signals. Comparing absolute HRV values between devices isn't meaningful. Even within a brand, algorithm updates can change the reported values without the underlying physiology changing.
Optical sensor accuracy
Wearables that use optical sensors can produce inaccurate readings under various conditions: motion during measurement, certain skin tones, dry skin, loose fit. Trend tracking is generally usable; absolute values may not be precise.
The "recovery score" is a blended metric
When a device tells you your "recovery" is at 65 percent, that number is some combination of HRV, sleep data, recent training, and other inputs blended by an algorithm. The exact formula isn't transparent, and the meaning of "65 percent" isn't standardized. Use it as a rough guide, not as a precise measurement.
Individual variation in what HRV means
What's a meaningfully low reading for one person might be normal for another. The personal baseline matters more than population norms.
The Hawthorne effect and overinterpretation
People who pay close attention to HRV may make different decisions than they would otherwise, which itself produces effects independent of the metric. Whether this is good (better-informed decisions) or bad (anxiety about numbers, overreaction to noise) depends on the user.
HRV doesn't capture everything about recovery
Subjective fatigue, soreness, mood, life stress, and other factors all matter. HRV is one input, not the complete picture.
For most people, the consumer HRV data is more useful for tracking trends and as one input to decision-making than as a precise daily prescription.
Stress and HRV
Beyond athletic recovery, HRV has clinical applications in stress management and mental health.
Chronic stress reduces HRV reliably. Conditions like anxiety disorders, depression, PTSD, and chronic stress states are associated with reduced HRV, with the reduction often correlating with symptom severity.
Interventions that address stress (meditation, yoga, breath work, therapy, addressing life stressors) have been shown to improve HRV over weeks to months in studies.
HRV biofeedback — using real-time HRV measurement during slow breathing exercises to maximize HRV during practice — has accumulated significant research support for stress, anxiety, and certain other conditions. The training appears to produce sustained improvements in autonomic regulation that persist between sessions.
For people interested in HRV as a stress tracking tool, the metric provides an objective marker that can complement subjective experience. Sometimes the data shows you're more stressed than you feel; sometimes it shows you're handling things better than your subjective experience suggests.
The same caveats apply: trends matter more than single readings, individual baselines matter more than population norms, and HRV is one input rather than the complete picture.
Sources
Plews, D. J., Laursen, P. B., Stanley, J., Kilding, A. E., & Buchheit, M. (2013). Training adaptation and heart rate variability in elite endurance athletes: Opening the door to effective monitoring. Sports Medicine, 43(9), 773–781.
Kiviniemi, A. M., Hautala, A. J., Kinnunen, H., & Tulppo, M. P. (2007). Endurance training guided individually by daily heart rate variability measurements. European Journal of Applied Physiology, 101(6), 743–751.
Manresa-Rocamora, A., Sarabia, J. M., Javaloyes, A., Flatt, A. A., & Moya-Ramón, M. (2021). Heart rate variability-guided training for enhancing cardiac-vagal modulation, aerobic fitness, and endurance performance: A methodological systematic review with meta-analysis. International Journal of Environmental Research and Public Health, 18(19), 10299.
Bellenger, C. R., Fuller, J. T., Thomson, R. L., Davison, K., Robertson, E. Y., & Buckley, J. D. (2016). Monitoring athletic training status through autonomic heart rate regulation: A systematic review and meta-analysis. Sports Medicine, 46(10), 1461–1486.
Shaffer, F., & Ginsberg, J. P. (2017). An overview of heart rate variability metrics and norms. Frontiers in Public Health, 5, 258.
Lehrer, P. M., & Gevirtz, R. (2014). Heart rate variability biofeedback: how and why does it work? Frontiers in Psychology, 5, 756.
Buchheit, M. (2014). Monitoring training status with HR measures: do all roads lead to Rome? Frontiers in Physiology, 5, 73.
Frequently Asked Questions
Is a higher HRV always better?
Higher trends are generally better, but the meaningful comparison is to your own baseline, not to other people. HRV varies enormously between individuals. A score that's 'low' for one person may be normal for another. Track your own changes over weeks rather than comparing to averages.
Should I skip workouts when my HRV is low?
Single-day low readings are usually noise. Persistent low readings over multiple days are a more reliable signal that recovery is incomplete. The right response to chronic low HRV is reduced training load, better sleep, and stress management — not just skipping today's workout.
What time should I measure HRV?
First thing in the morning, before getting out of bed, in roughly the same conditions every day. Consistency matters more than the exact time. Measurements taken at variable times throughout the day are too affected by activity, posture, and meals to be useful for tracking.
Why does my HRV drop after a hard workout?
Sympathetic nervous system activation from training, plus the recovery work the body is doing afterward, both reduce HRV. The drop is normal and expected. The question is how quickly your HRV returns to baseline — fast recovery indicates good adaptation; persistently suppressed HRV after a session indicates incomplete recovery.



0 Comments
Leave a comment
Your email won't be published. Required fields are marked with *.